Generating Stable Cell Lines by Lentiviral Transductions

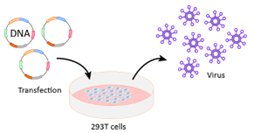
Lentiviral production

Lentiviral transduction to generate stable lines

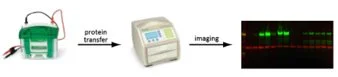
Western Blot (WB) analysis
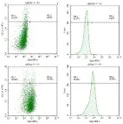
FACS analysis

FACS cell sorting

Single cell cloning

Total RNA isolation

RT-PCR and Sanger sequencing
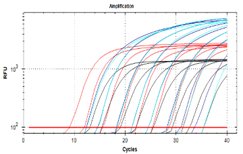
96-well RT-qPCR

Graph showing amplification over cycles with multiple curves in various colors.
Diagram illustrating the process of DNA transfection into 293T cells, leading to virus production.
Diagram showing protein transfer, imaging device, and resulting fluorescence image
Four scatter plots showing data points with fluorescence intensity on axes, likely flow cytometry data, with different gating regions highlighted.
Line graph with multiple colored lines representing data trends