0
Skip to Content
Home
Contact us
Open Menu
Close Menu
Home
Contact us
Open Menu
Close Menu
Home
Contact us
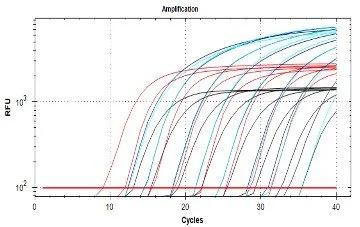
RT-PCR
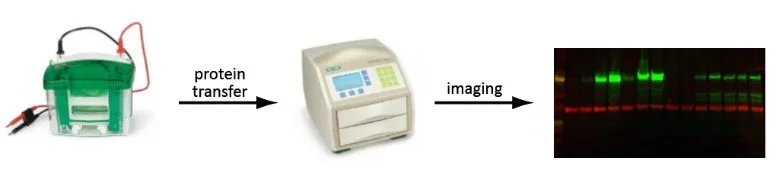
Western Blot (WB) analysis
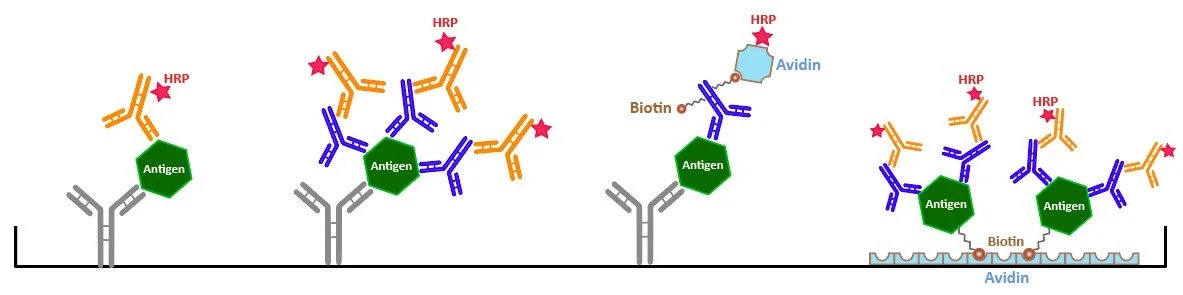
ELISA