
Biosettia Lentiviral Vector Systems
For your reference, below are Biosettia lentiviral vector systems currently used to generate cell lines for gene expression or overexpression.
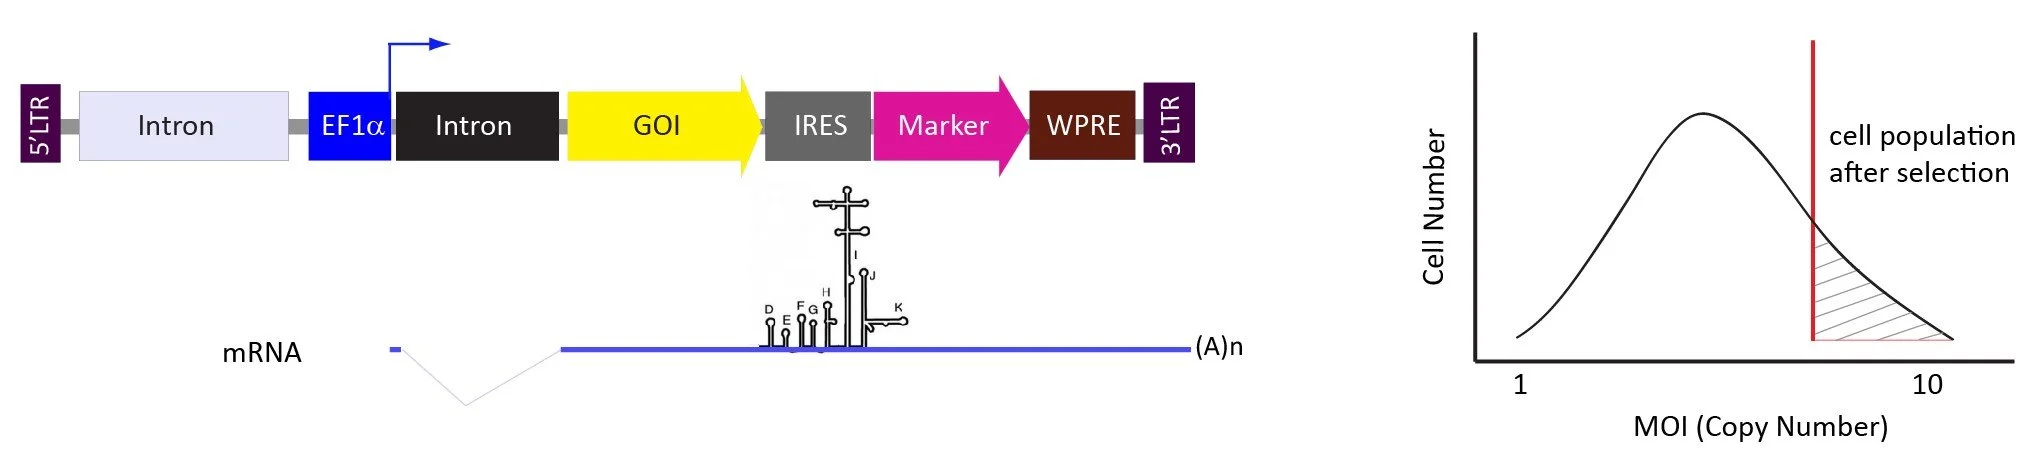
The pLV-EF1a-GOI-IRES-marker vector system.
The selection markers are expressed from IRES to favor the transduced cells with higher copy numbers of lentiviral genome.
The level of gene expression from IRES generally is around 7-10 times lower than the same gene expressed directly from the promoter before IRES. Therefore, the antibiotic selection will favor the transduced cells with higher copy numbers, but the protein toxicity will be the concern. The cells transduced with for example 1-5 copies of viruses may not survive after selection, especially for the cells with lower transduction efficiency such as primary cell, blood cells, and rodent cells, etc. This vector system is good for overexpression but transduction efficiency will be important and higher MOIs, e.g. 10-50, transduction is recommended.
List of vectors:
pLV-EF1a-GOI-IRES-Puro
pLV-EF1a-GOI-IRES-Hyg
pLV-EF1a-GOI-IRES-Bsd
pLV-EF1a-GOI-IRES-Neo
pLV-EF1a-GOI-IRES-GFP
pLV-EF1a-GOI-IRES-RFP
pLV-EF1a-GOI-IRES-GFP-Bsd
pLV-EF1a-GOI-IRES-RFP-Bsd
pLV-EF1a-GOI-IRES-RFP-Puro
pLV-EF1a-GOI-IRES-RFP-Neo
pLV-EF1a-GOI-IRES-GFP-Puro
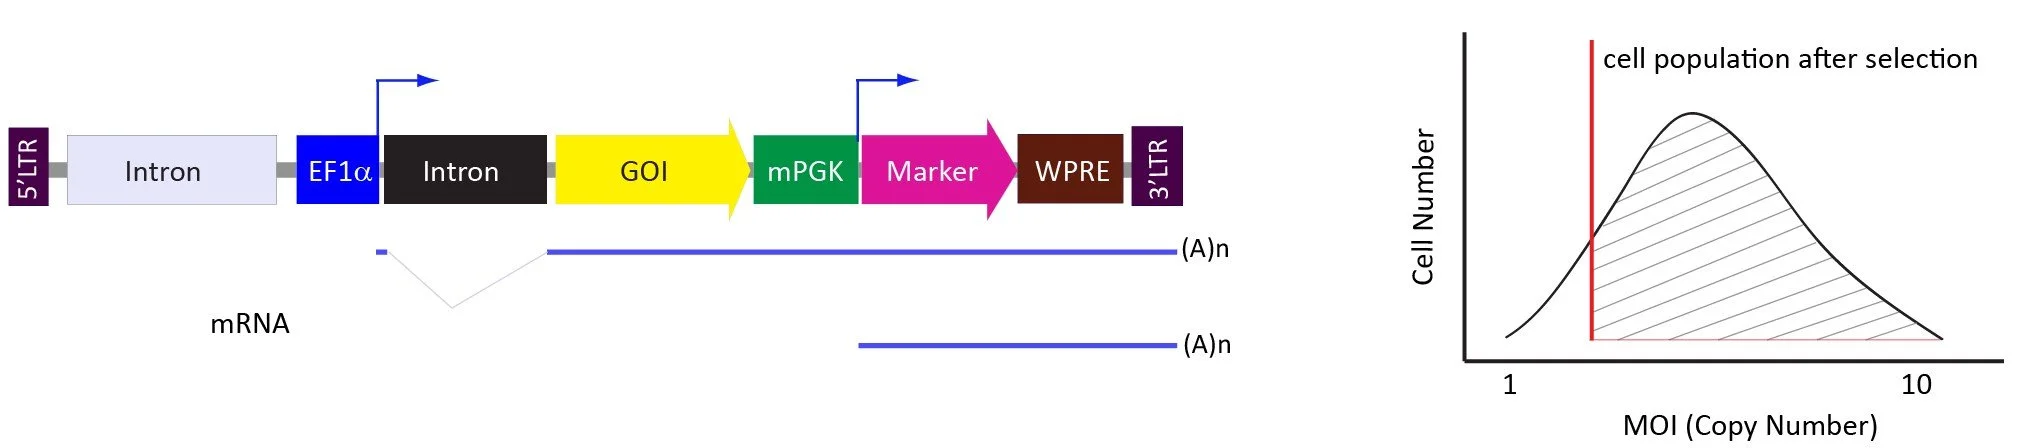
The pLVpuro-EF1a-GOI (dual promoter) vector system.
The antibiotic selection marker is expressed from the second (mouse PGK) promoter to give a broader range of GOI expression in the selection pool. The dual promoter vector system gives the user more flexibility to generate stable cell lines/pools with low, medium, and high level of GOI expression by using MOIs such as 1-5, 5-10, and 20-50, respectively.
List of vectors:
pLVpuro-EF1a-GOI
pLVbsd-EF1a-GOI
pLVhyg-EF1a-GOI
pLVneo-EF1a-GOI
pLVgfp-puro-EF1a-GOI
pLVgfp-bsd-EF1a-GOI
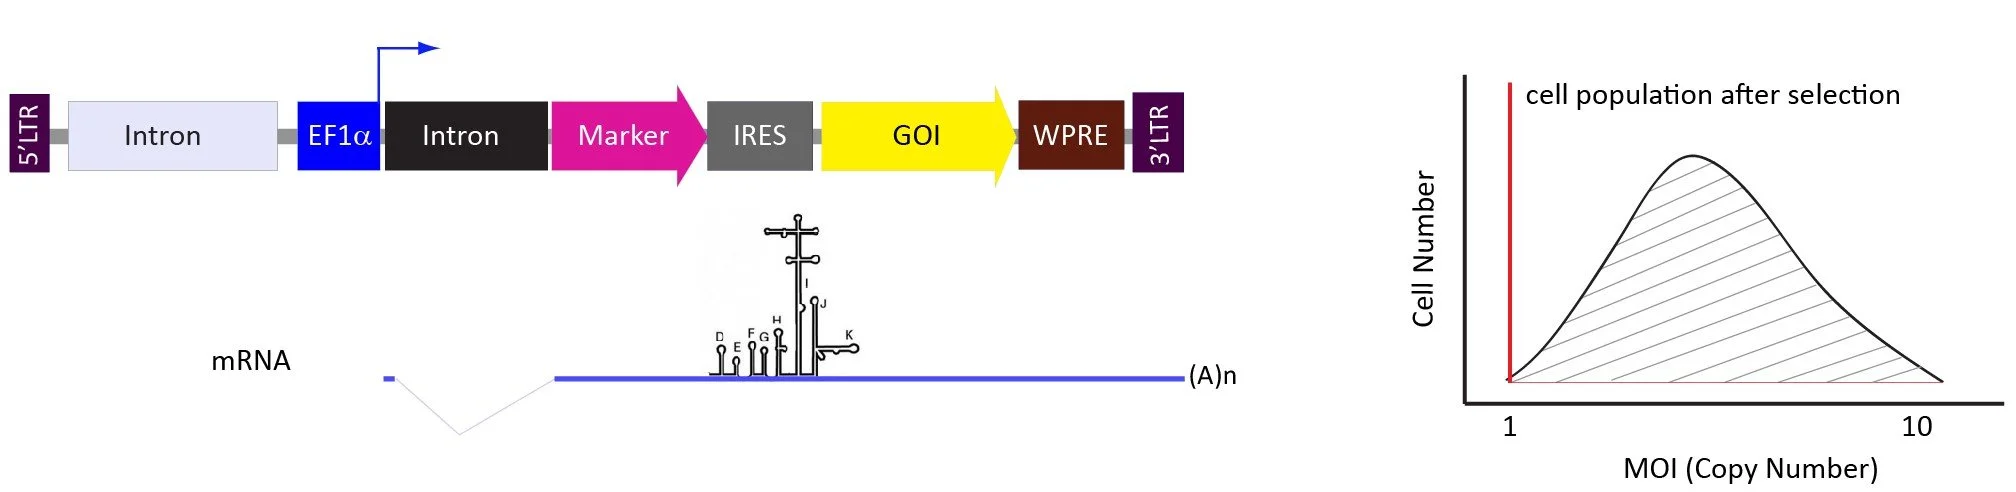
The pLV-EF1a-marker-IRES-GOI vector system.
The GOI is expressed from IRES if overexpressed GOI is toxic to the cells or the users prefer to express GOI closed to the endogenous level.
List of vectors:
pLV-EF1a-Puro-IRES-GOI
pLV-EF1a-Bsd-IRES-GOI
pLV-EF1a-Hyg-IRES-GOI
pLV-EF1a-Neo-IRES-GOI
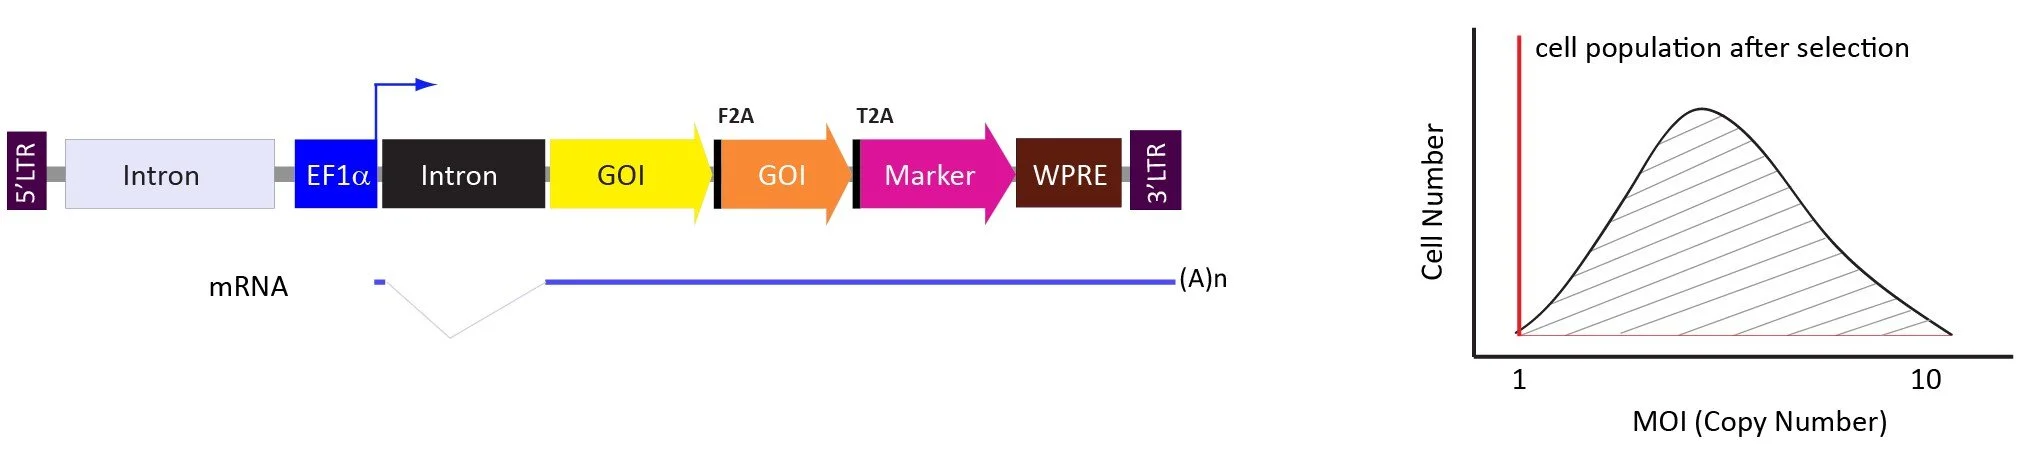
The pLV-EF1a-2A vector system.
The pLV-EF1a-2A vector system allows users to turn the lentiviral vector into a polycistronic expression cassette in which multiple GOIs are joined by self-cleaving 2A peptides. The advantage of this vector system is all coding sequences are expressed from the same promoter and the level of each protein expression is close to 1 : 1 ratio, but generally more 2A less protein expressed.
List of vectors:
Upon request, the vector will be made up to 5 coding sequences in the same polycistronic unit.
Biosettia have developed a unique way to determine the functional titers.
Transduce 5 x 10⁵ H1299 cells/well in 6-well plate with 20 ul of lentiviruses in 2 ml DMEM + 10% FBS and 8 ug/ml polybrene, spin at 1,000 g for 60 min, extract genomic DNA around 16 hr post-transduction for real-time PCR analysis. The GFP-Bsd lentivirus pre-titered in H1299 cells by serial dilution and Blasticidin selection is used as reference copy number to determine the functional titers of lentivirus samples. The primers targeting BRCA1 locus is used to determine genomic DNA copy number for normalization. Biosettia’s virus titering method determines the copy numbers of reverse transcribed lentiviral genome inside of the transduced H1299 cells which is more accurate than p24 ELISA and viral RNA qPCR, and time saving than antibiotic selection from virus serial dilution.
In general, pLVpuro-EF1a-GOI vector system should serve most purposes, but desired level of gene expression and target cell transduction efficiency should be considered. We recommend viral transduction with at least two MOIs to increase the opportunity of getting different expression levels in the model cells. The two cell populations will be more overlapped if cells are more difficult to transduce.
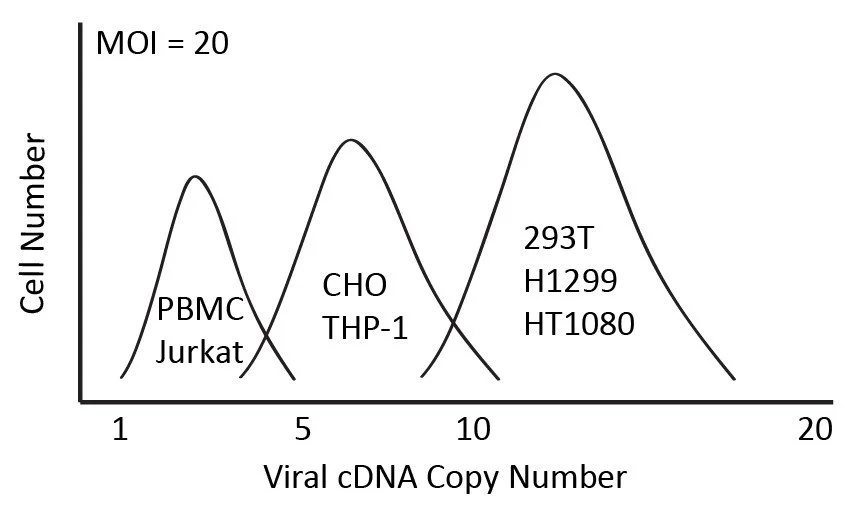
The lentiviruses are titered in H1299 cells but MOI is a reference number, and the final copy numbers of lentiviral integration and level of gene expression is mainly determined by the cell types and transduction efficiency. The final copy numbers in the cells vs. same MOI in different cell types is illustrated below.
Our virus titers are generally around 3E+7 to 1E+8 IU/ml while titered by qPCR method mentioned above.
Regarding the level of gene expression, we have compared EF1a, EF1x (EF1a without its first intron) and mouse PGK (mPGK) promoters expressing mNeonGreen in different cell lines.
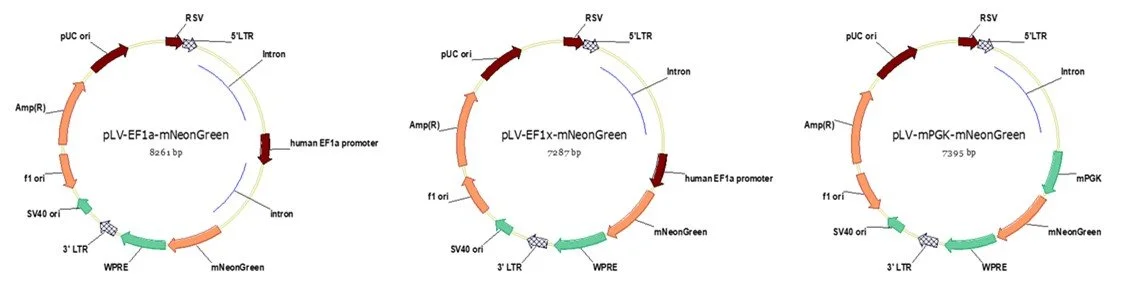
We observed the promoter strength of EF1a : EF1x : mPGK is about 10 : 2 : 1 in model cell lines listed below.
| Cell lines / mNeonGreen | MFI FOLD |
| CHO-K1 | 1 |
| CHO-K1 EF1a MOI=3, Day 4 | 28.3 |
| CHO-K1 EF1a MOI=10, Day 4 | 34.3 |
| CHO-K1 EF1a MOI=30, Day 4 | 44.2 |
| CHO-K1 EF1x MOI=3, Day 4 | 5.7 |
| CHO-K1 EF1x MOI=10, Day 4 | 6.4 |
| CHO-K1 EF1x MOI=30, Day 4 | 5.9 |
| CHO-K1 mPGK MOI=3, Day 4 | 2.7 |
| CHO-K1 mPGK MOI=10, Day 4 | 3.8 |
| CHO-K1 mPGK MOI=30, Day 4 | 4.4 |
| H1299 | 1 |
| H1299 EF1a MOI=1, Day 4 | 20.7 |
| H1299 EF1a MOI=5, Day 4 | 22.8 |
| H1299 EF1a MOI=20, Day 4 | 42.3 |
| H1299 EF1x MOI=1, Day 4 | 5.3 |
| H1299 EF1x MOI=5, Day 4 | 6.3 |
| H1299 EF1x MOI=20, Day 4 | 8.2 |
| H1299 mPGK MOI=1, Day 4 | 2.6 |
| H1299 mPGK MOI=5, Day 4 | 2.9 |
| H1299 mPGK MOI=20, Day 4 | 4.2 |
| A549 | 1 |
| EF1a, MOI=1 | 28 |
| EF1a, MOI=5 | 43.6 |
| EF1a, MOI=10 | 56.8 |
| EF1a, MOI=30 | 120.6 |
| EF1a, MOI=50 | 199.8 |
| mPGK, MOI=1 | 3.5 |
| mPGK, MOI=5 | 4.7 |
| mPGK, MOI=10 | 5.9 |
| mPGK, MOI=30 | 10.3 |
| mPGK, MOI=50 | 16.6 |